
Our Mission
We give everyone the opportunity to learn and develop the right skills so lives and communities are strengthened.
Meet Our Chancellor
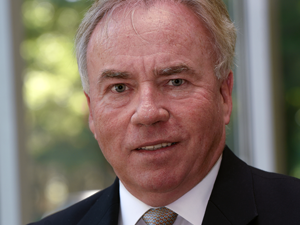
Glenn DuBois is a community college success story. Before ever stepping foot on campus, DuBois admits, his professional ambitions consisted of merely moving up from the kitchen to the dining area of the neighborhood restaurant he worked at after high school. However, a nagging mother and some inspiring professors saw more in him, and eventually got him to see it, too.
During DuBois’s tenure, Virginia’s Community Colleges have signed groundbreaking guaranteed transfer agreements with more than 36 public and private universities. Additionally, he has helped establish the VCCS as the state’s leading provider of workforce development services and maintained a tuition rate that is one-third of the comparable rate at Virginia’s public universities.
Governance
Virginia’s Community Colleges are governed by the State Board for Community Colleges. Board members are appointed by the Govenor of Virginia to four-year terms and may serve only two consecutive terms.
News
Given the increasing demand for our academic services and workforce programs, Virginia’s Community Colleges are helping to transform the higher education landscape and the lives of thousands of Virginians every year.
Staff
VCCS System Office staff members are identified alphabetically by last name. Individual titles, email addresses and phone numbers are also available. Activate the button below to begin your search.
A Brief History of VCCS
2017
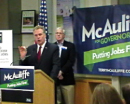 Governor Terry McAuliffe kicks off the VCCS 50th anniversary gala event, which raises nearly $2.3 million for Virginia’s Community Colleges.
2016
 The Virginia General Assembly, with bi-partisan support, passes legislation creating the nation’s first pay-for-performance workforce training program called the Workforce Credentials Grant (later called FastForward).
2015
 The VCCS launches Complete 2021, a six-year statewide strategic plan.
2013
 The number of Hispanic and Latino students attending Virginia’s Community Colleges increases 58% between 2008-2013, and the number of those students graduating increases by 150%.
2012
The Governor signs into law a measure to expand Dual Enrollment offerings into every Virginia high school.
2007
 VCCS begins Great Expectations to counter the low numbers of former foster care youth who enroll in and graduate from college.
2005
 VCCS Career Coaches begin working in high schools to help students create career and college plans, and convince more students to go to college.
2004
 VCCS and Virginia Tech sign the first ever guaranteed admissions agreement for community college graduates.
2002
 VCCS Middle College begins as a recovery program helping high school dropouts earn postsecondary credentials.
1998
 The Virginia General Assembly tasks the VCCS with coordinating workforce training at the postsecondary level.
1996
 VCCS begins offering online classes.
1987
 Dual Enrollment begins, allowing high school students to earn community college credit for particular classes.
1972
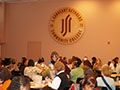
J. Sargeant Reynolds is the 23rd and final community college to open.
1966
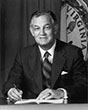 Gov. Mills Godwin creates the VCCS, financed by the state’s first ever sales tax. Two colleges open, serving 7,500 students.
Complete 2021
The newest Strategic Plan, Complete 2021, contains a single goal…
…To triple the credentials students earn in academic and workforce areas.
A Six Year Strategic Plan for Virginia’s Community Colleges
Virginia’s community colleges serve an estimated 400,000 people across the state. The opportunities we provide include some of the most cutting-edge and highly-demanded training and education available.
But, simply accessing those opportunities is no longer enough. You have to earn a credential to make it count toward a career.
Over the next ten years, Virginia will need to fill 1.5 million jobs. The majority of these jobs will require a postsecondary credential – an associate degree and the certifications and licensures that are our bread-and-butter.
To accommodate the demand for these middle-skill-level jobs (more than a high school degree but less than a bachelor’s), Virginia’s Community Colleges are embarking on a new six-year strategic plan to triple the number of credentials that our students earn by the year 2021.
Let’s Get Down to the Numbers
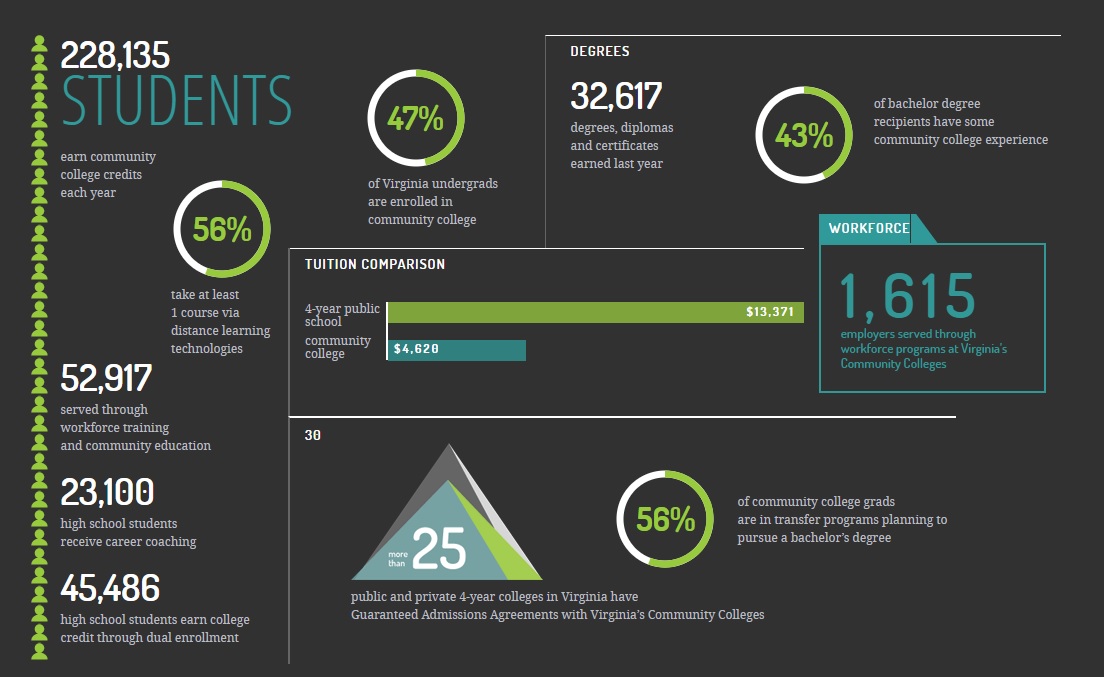
Enrollment Numbers
| Year | College/System | Annual Full-time Equivalent | Annual Headcount | Fall Headcount |
| 2018-2019 | VCCS | 98,858 | 228,135 | 161,589 |
| 2017-2018 | VCCS | 101,570 | 234,369 | 166,866 |
| 2016-2017 | VCCS | 105,242 | 241,412 | 170,869 |
| 2015-2016 | VCCS | 111,124 | 252,758 | 176,887 |
| 2014-2015 | VCCS | 116,249 | 262,073 | 183,443 |
| 2013-2014 | VCCS | 120,827 | 273,026 | 189,117 |
| 2012-2013 | VCCS | 123,651 | 279,970 | 192,895 |
| 2011-2012 | VCCS | 129,652 | 288,834 | 197,226 |
| 2010-2011 | VCCS | 128,416 | 286,920 | 195,417 |
| 2009-2010 | VCCS | 122,479 | 281,239 | 189,273 |
| 2008-2009 | VCCS | 108,572 | 262,444 | 175,487 |
Distance Learning Numbers
| Year | Enrollment in Distance Learning Only | Enrollment in Distance Learning and Regular Courses | Total Enrollment in Distance Learning | Percent Enrolled in Distance Learning |
| 2018-2019 | 47,390 | 80,037 | 127,427 | 55.9% |
| 2017-2018 | 46,824 | 79,929 | 126,753 | 54.1% |
| 2016-2017 | 46,845 | 83,260 | 130,105 | 53.9% |
| 2015-2016 | 47,835 | 88,178 | 136,013 | 53.8% |
| 2014-2015 | 47,050 | 96,022 | 143,072 | 54.6% |
| 2013-2014 | 46,065 | 98,204 | 144,269 | 52.8% |
| 2012-2013 | 44,838 | 96,302 | 141,140 | 50.4% |
| 2011-2012 | 43,700 | 99,155 | 142,855 | 49.5% |
| 2010-2011 | 39,427 | 96,054 | 135,481 | 47.2% |
| 2009-2010 | 37,244 | 85,730 | 122,974 | 43.7% |
| 2008-2009 | 31,818 | 69,199 | 101,017 | 38.5% |
Dual Enrollment Numbers
| Year | Students in Dual Enrollment | Percent in Dual Enrollment |
| 2018-2019 | 45,486 | 19.9% |
| 2017-2018 | 44,079 | 18.8% |
| 2016-2017 | 40,826 | 16.9% |
| 2015-2016 | 37,926 | 15.0% |
| 2014-2015 | 34,784 | 13% |
| 2013-2014 | 34,384 | 12.6% |
| 2012-2013 | 31,620 | 11.3% |
| 2011-2012 | 31,100 | 10.8% |
| 2010-2011 | 31,285 | 10.9% |
| 2009-2010 | 31,962 | 11.4% |
| 2008-2009 | 32,550 | 12.4% |
Student Success: Graduation and Retention Numbers
| Year | Students Earning a Graduation Credential | Number of Credentials Awarded |
| 2018-2019 | 25,775 | 32,617 |
| 2017-2018 | 25,797 | 32,607 |
| 2016-2017 | 26,192 | 32,555 |
| 2015-2016 | 26,902 | 33,594 |
| 2014-2015 | 25,562 | 31,194 |
| 2013-2014 | 24,437 | 30,984 |
| 2012-2013 | 26,079 | 31,776 |
| 2011-2012 | 25,922 | 31,556 |
| 2010-2011 | 22,495 | 26,853 |
| 2009-2010 | 18,355 | 21,155 |
| 2008-2009 | 16,546 | 18,410 |
Financial Aid Numbers
| Year | Students Receiving Financial Aid | Percent of All Students | Total Amount Disbursed |
| 2018-2019 | 93,942 | 35.5% | $380.7 million |
| 2017-2018 | 100,159 | 36.3% | $394.1 million |
| 2016-2017 | 88,189 | 37.0% | $410.1 million |
| 2015-2016 | 95,290 | 38.2% | $456.4 million |
| 2014-2015 | 106,309 | 40.8% | $507.6 million |
| 2013-2014 | 110,220 | 40.8% | $523.5 million |
| 2012-2013 | 99,860 | 35.7% | $494.1 million |
| 2011-2012 | 100,108 | 34.7% | $480.4 million |
| 2010-2011 | 91,838 | 32.0% | $434.5 million |
| 2009-2010 | 79,127 | 28.1% | $350.0 million |
| 2009-2010 | 60,112 | 22.9% | $220.0 million |
| 2008-2009 | 51,922 | 20.8% | $172.6 million |